
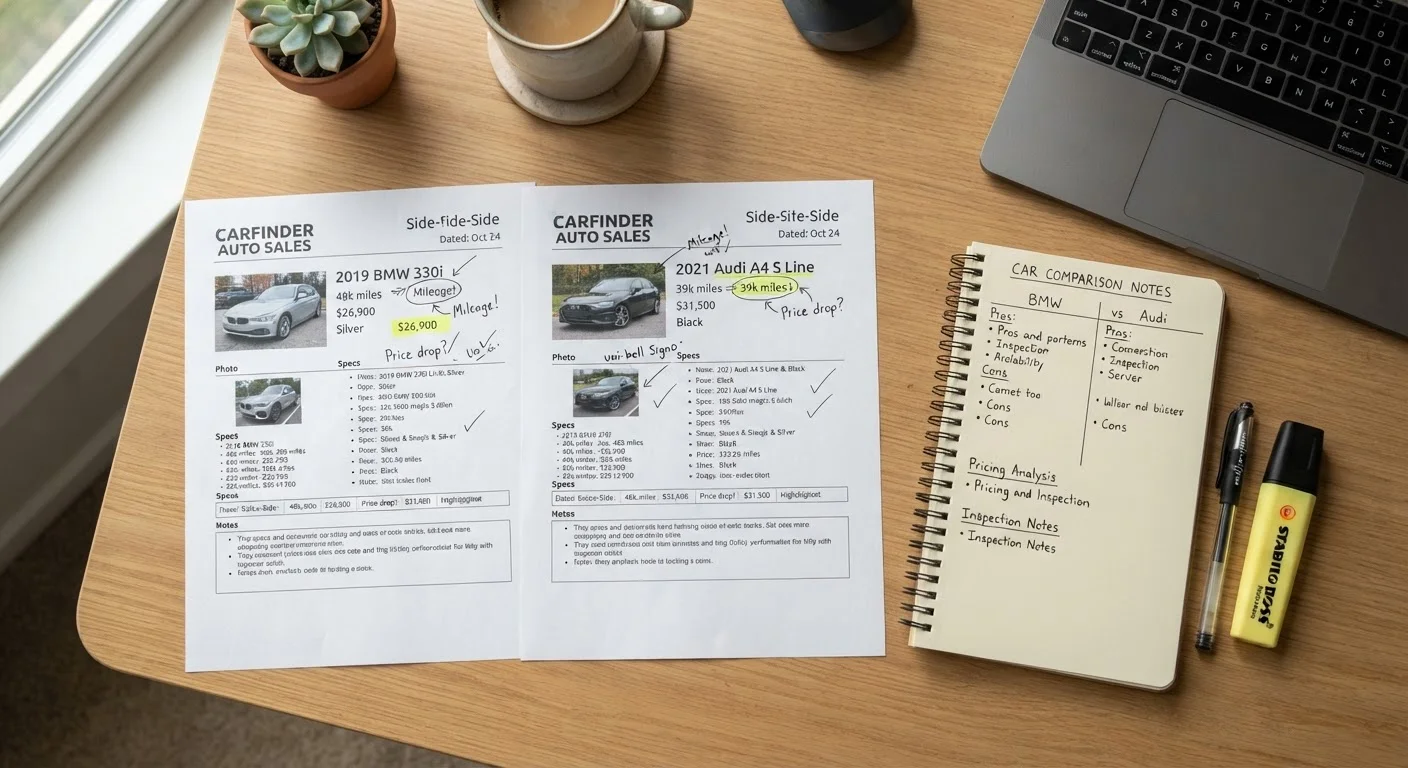
Why Side-by-Side Browsing Misleads Buyers
Scrolling through multiple listings for the same model feels like comparison shopping, but it rarely functions that way. Asking prices sit prominently at the top of every card; the variables that actually explain those prices - trim level, options, ownership history, and geographic demand - are buried in fine print or absent entirely. The result is that buyers anchor on price differences without understanding what drives them.
A structured approach forces the hidden variables into view before price enters the equation. This is especially consequential for models with wide trim spreads, where a base variant and a well-optioned variant of the same year can carry legitimately different market values. The same principles apply whether you are shopping a mainstream sedan or evaluating a specialty vehicle - as factors behind classic vehicle valuations illustrate, condition and documentation compound in ways that a headline price cannot convey.
The goal of this process is not to find the numerically lowest price - it is to identify which listing offers the most value once all relevant variables are normalized. A seemingly high price can be entirely rational; a low one can conceal costs that appear later. For a full treatment of that dynamic, see why a low asking price can be the most expensive number.
Trim Differences Distort Every Comparison
Comparing an entry-level trim to a fully loaded variant of the same model year produces a meaningless price gap. Before you do anything else, confirm you are comparing identical - or explicitly adjusted - configurations. Two listings for the same nameplate can differ by thousands of dollars in MSRP equivalent purely from factory options.
What You Need Before You Start
Effective comparison work requires a minimum dataset for each listing. If a listing cannot provide - or the seller will not disclose - the trim level, mileage, and vehicle identification number (VIN), it cannot be meaningfully compared to others and should be deprioritized until that information is available.
What you will need
With these inputs in place, the steps below produce a structured ranking that makes your shortlisting decisions defensible and your negotiation conversations more focused.
Vehicle History Report
Reveals accident records, ownership count, title status, and odometer readings to validate listing claims.
Online Valuation Tool
Provides a market-based price estimate as a starting reference point for each listing.
Comparison Spreadsheet
Captures normalized data across all listings so variables can be evaluated side by side.
Manufacturer Window Sticker Decoder or Build Sheet
Confirms exact factory options and packages included on a specific vehicle to enable accurate trim-level comparison.
The Comparison Process: Step by Step
Standardize Your Listing Pool
Before comparing prices, confirm every listing in your pool represents genuinely equivalent vehicles. Filter by the same model year (or a defined range you have researched), the same trim level, and the same drivetrain. If listings span multiple trims, note the MSRP difference between those trims at launch so you can apply a rational adjustment later.
Discard listings that lack basic facts - trim designation, mileage, or transmission type - unless you are willing to contact the seller to fill the gaps before proceeding.
Pull a Vehicle History Report for Each Listing
Run a history report on every vehicle that passes your initial filter. Record the number of previous owners, any reported accidents (and their stated severity), title status, and whether the odometer readings across report entries are consistent with the seller's claimed mileage.
A single moderate accident on record does not automatically disqualify a vehicle, but it does anchor a downward price adjustment relative to a clean-history equivalent. Use these findings as pricing levers, not pass/fail gates.
Enter Every Listing Into a Comparison Spreadsheet
Create one row per listing with these columns at minimum: asking price, model year, trim, mileage, accident history (yes/no and count), number of owners, available service records, seller type (private or dealer), and geographic location. Add a notes column for anything unusual in the listing description.
This grid makes it immediately visible when a listing is priced above its peers without corresponding advantages in condition or history.
[tip_callout]Apply Mileage and Condition Adjustments
Online valuation tools typically provide mileage-adjusted estimates - use these as a reference to quantify how much above or below average mileage each listing sits. As a general framework, higher-than-average mileage warrants a downward price adjustment, while significantly lower mileage may justify a modest premium, depending on vehicle age and use patterns.
Condition adjustments are harder to quantify from listings alone. Use photo quality, description specificity, and seller responsiveness as proxies until you can inspect in person. See how to use valuation tools effectively for a fuller breakdown of where automated estimates fall short.
Account for Regional Price Variation
Search the same model in at least two different geographic markets to calibrate whether the prices you are seeing are locally inflated or deflated. High demand for trucks and SUVs in certain regions - and for fuel-efficient vehicles in dense urban markets - can shift comparable listings by several percentage points.
If a listing from another region looks materially cheaper, calculate the realistic cost of transport or a retrieval trip before counting that gap as savings. For trucks and SUVs specifically, regional pricing variation is particularly pronounced - see the trucks and SUVs comparison hub for context on how market demand affects these segments.
Rank Listings by Adjusted Value, Not Asking Price
Once you have gathered history data, mileage adjustments, and regional context, add a calculated column to your spreadsheet: adjusted value score. This does not need to be a precise dollar figure - a simple relative ranking (1 = strongest value, 5 = weakest) based on your combined findings is sufficient to guide which listings merit follow-up contact or an in-person visit.
Cross-reference your rankings with the pre-offer checklist before contacting any seller, to confirm each shortlisted listing meets the minimum information standards for a fair price assessment.
Completing all six steps typically takes between 30 and 90 minutes depending on how many listings you are evaluating and how readily sellers respond to information requests. The time invested tends to pay off during negotiation, where having documented comparisons gives you a concrete basis for discussing price adjustments.
Market Geography Skews Your Baseline
Prices for the same model can vary noticeably by region due to local demand, climate preferences, and inventory levels. A listing 400 miles away may look underpriced but could carry shipping or relocation costs that erode the apparent savings. Always factor in the full acquisition cost, not just the sticker figure.